

For easy identification of bottlenecks in your warehouses setup, we have incorporated two highly valuable graphs in Spendview for Snowflake.
To find them:
1) On the menu bar, click Usage.
2) Focus on the last two graphs:
-
Warehouse spilling
-
Warehouse queueing
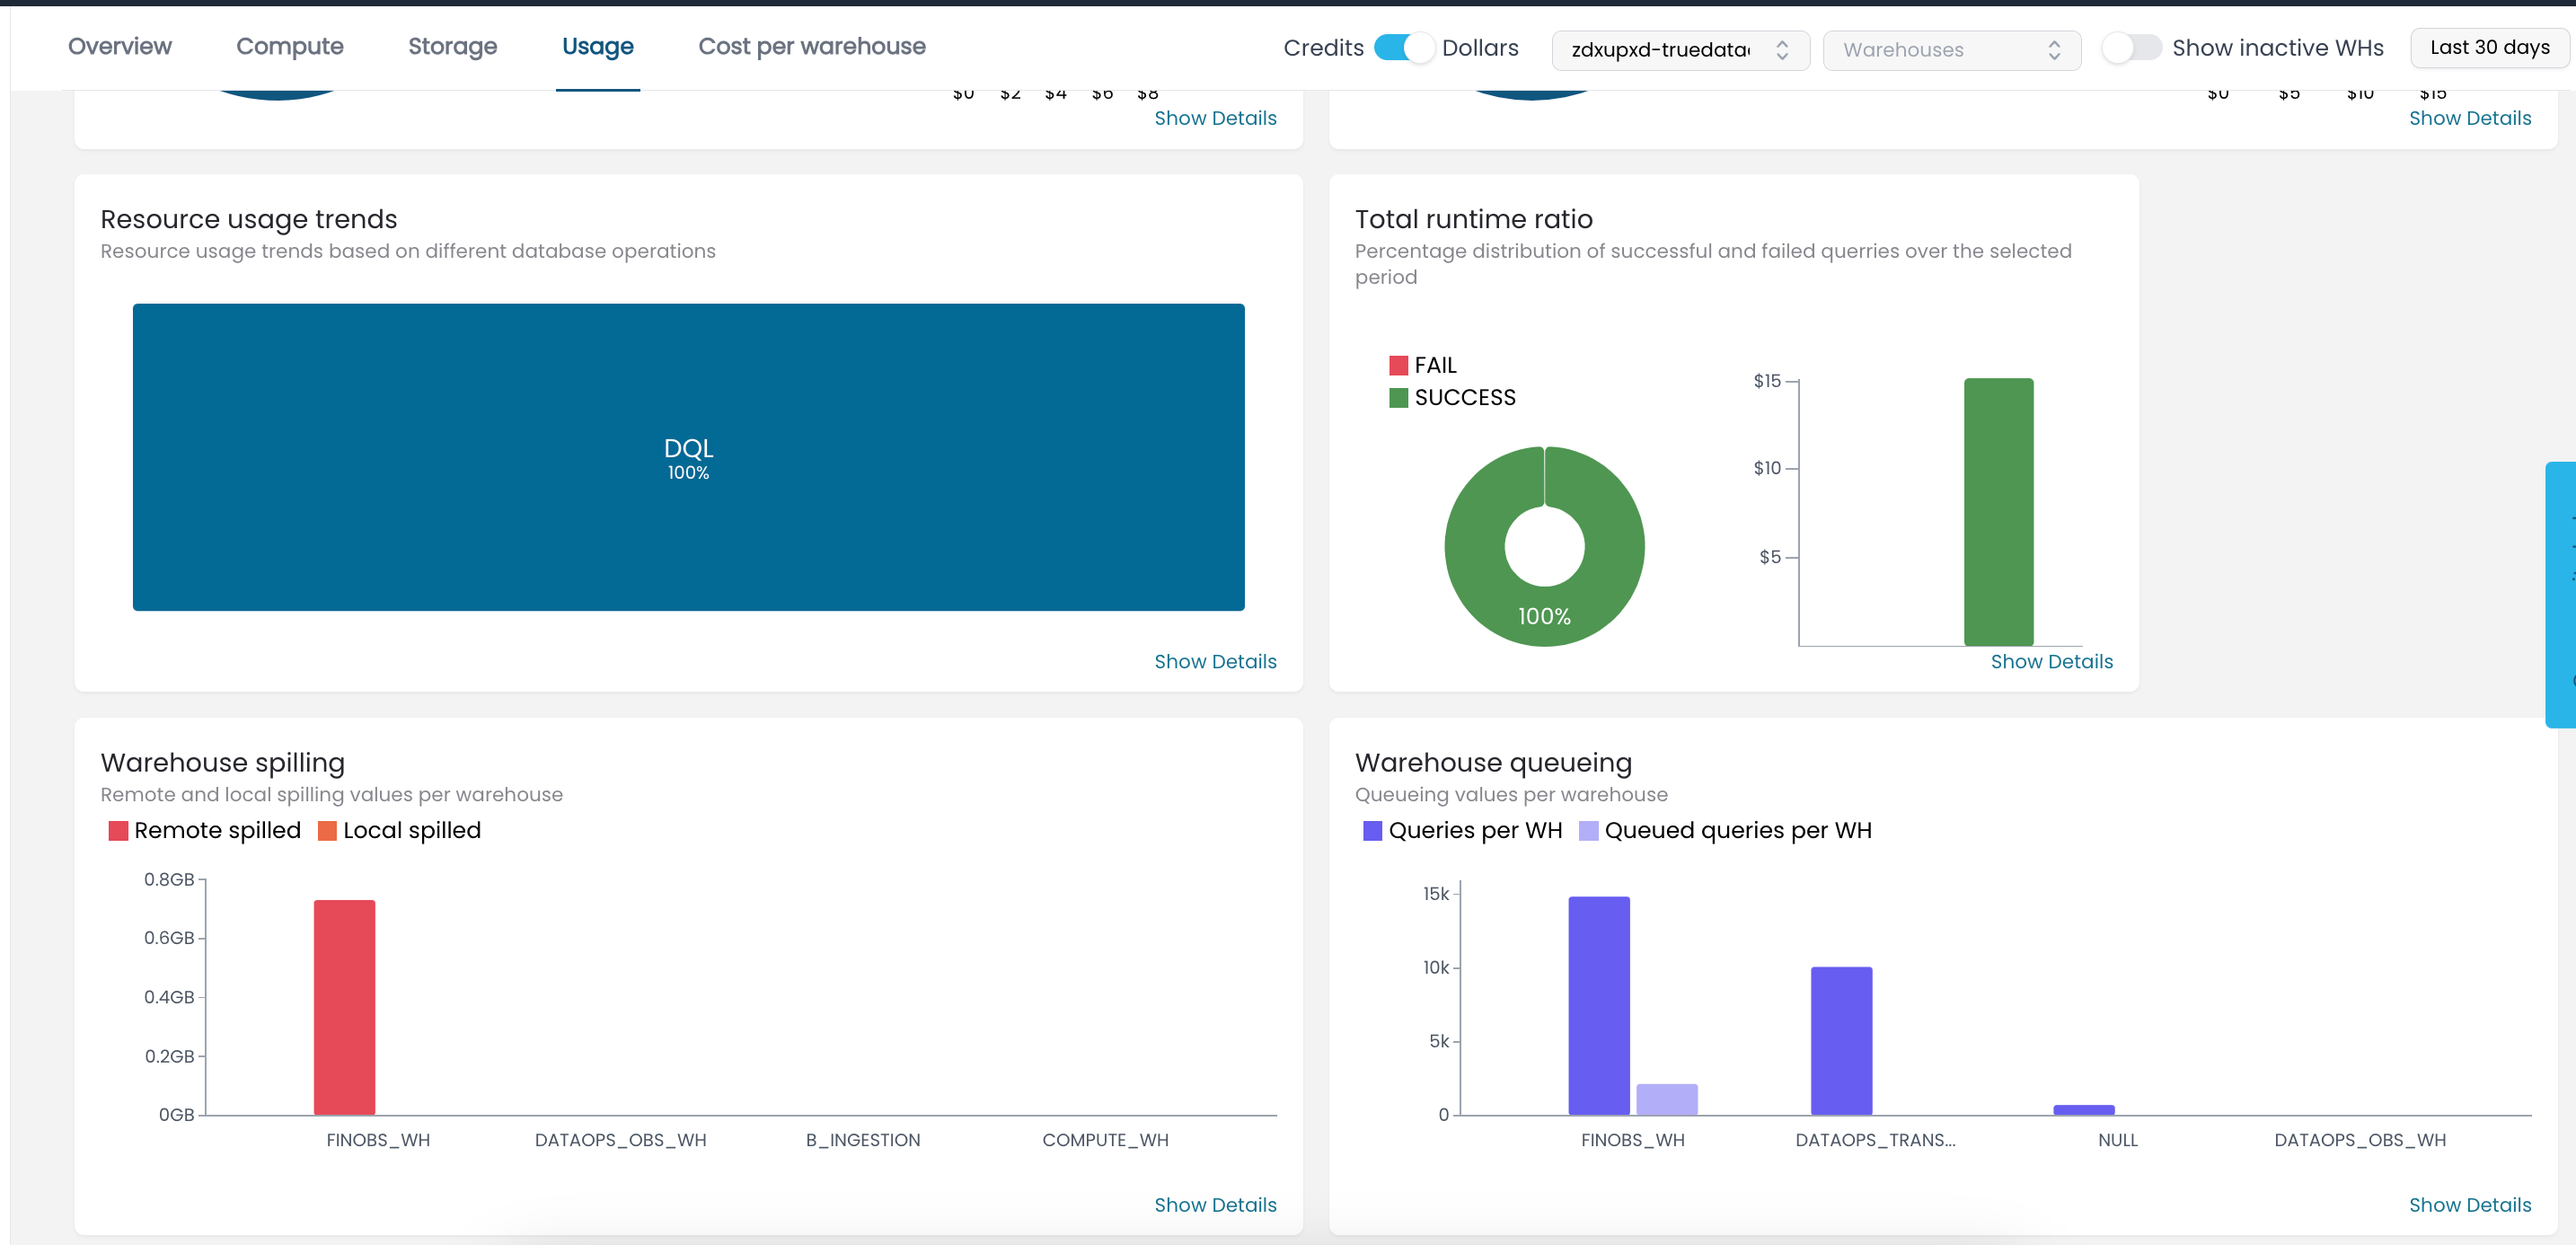
Both have similar structures, featuring two bars per warehouse, yet let us explore their details more closely.
Warehouse spilling.
First what exactly is spilling?
If you are not familiar with the Snowflake warehouse spilling, you can read more about it in this article.
Long story short, the spilling is impacting query performance since the engine needs to temporarily store some of the query data on a local or remote storage – the warehouse memory is not enough to execute the query.
Ideally, you will have no spilling or at most just a few GBs. However, if you discover that a warehouse has a lot of spilled GBs, it is recommended to take necessary actions.
With this graph, identifying this issue is straightforward. Each warehouse is represented by two bars: red shows remote spilling (less desirable), and orange shows local spilling (still not ideal but faster).
Th action involves identifying the heavy queries and attempting to optimize them. If there is no room for optimization, then we should change the warehouse size to a bigger one.
Warehouse queueing
Again, what exactly is queueing?
If you are not familiar with the Snowflake warehouse queueing, you can read more about it in this article.
Queueing refers to queries that are waiting for another query to finish before being executed. That is not necessarily a problem as it means that our warehouse is utilized. However, if the queries are waiting very often or for too long it may become annoying.
That is why we have created this graph that contains two bars per warehouse: the left one shows the number of executed queries, and the right one shows the number of queries that had to wait before execution.
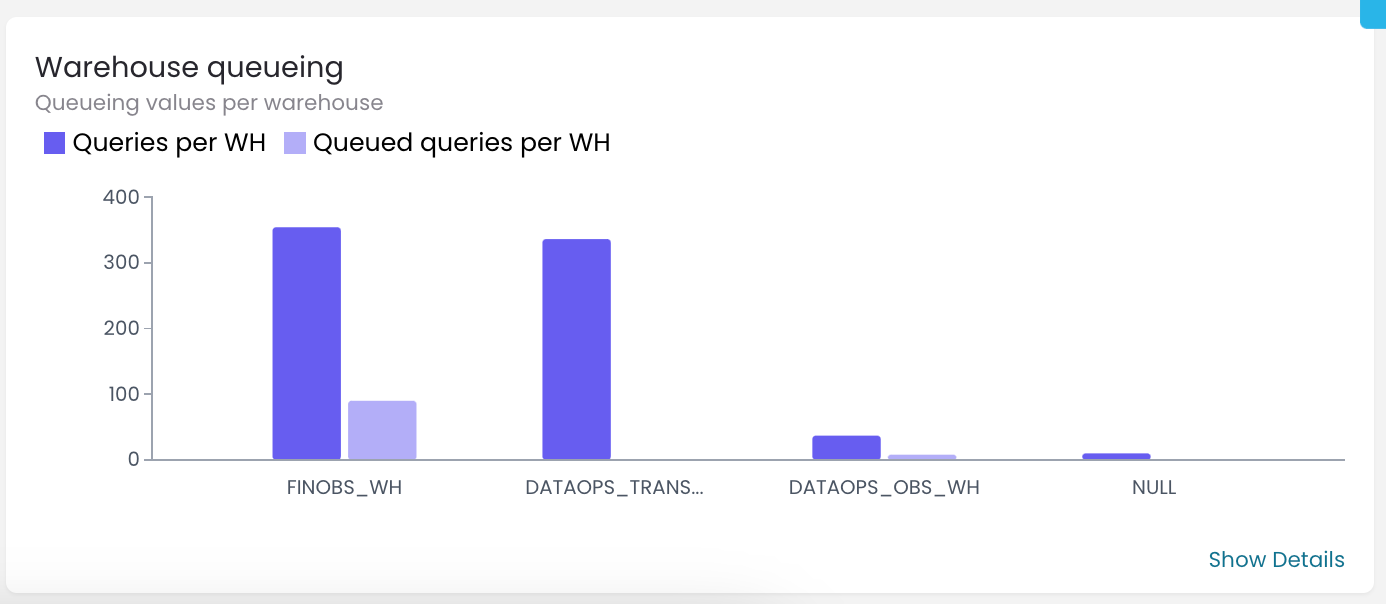
If you see that for some warehouse, there are consistently a lot of queries that are waiting in the queue, you might consider moving some of the queries to another warehouse. Alternatively, you can explore the advantage of the multi cluster warehouse feature that Snowflake provides. If you are not familiar with the multi-cluster warehouse, you can read more about it at Multi-Cluster Warehouses.
These are two methods to identify bottlenecks in your warehouse setup. I hope you find them useful! Enjoy your DataOps Spendview for Snowflake experience!